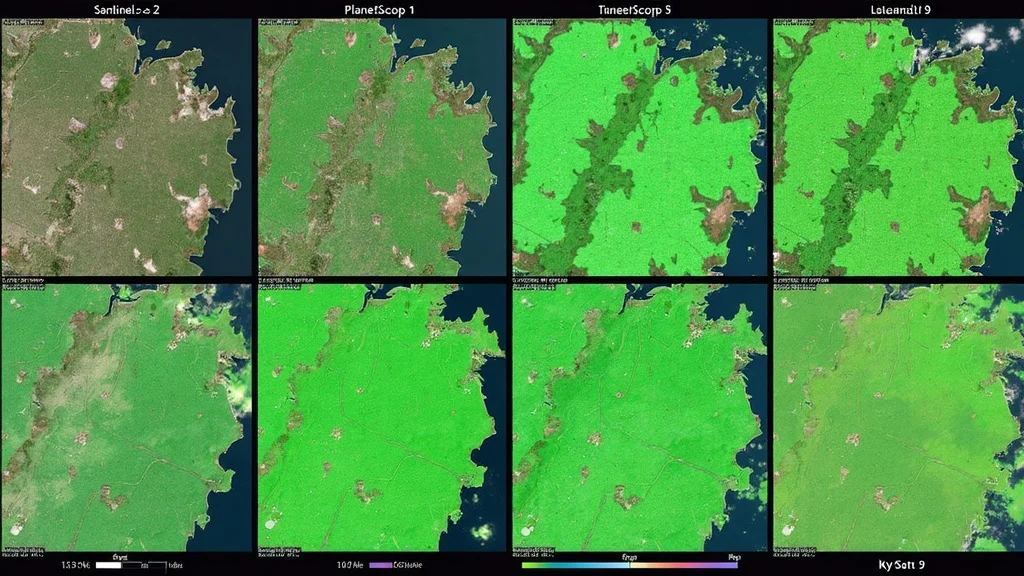
NDVI satellite crop monitoring 2026 employs state-of-the-art multispectral payloads (Sentinel-2, PlanetScope, Landsat 9) to quantify crop canopy reflectance using the Normalized Difference Vegetation Index (NDVI), an optical sensor-derived metric of vegetation health. These systems deliver 2–10m spatial resolution, 1–5 day revisit intervals, and NDVI output as geo-referenced raster data, supporting sub-zone crop monitor integration. Validated trials (Embrapa, 2026; INRAE, 2026) establish a sub-10-day pre-visual detection window—enabling precision ag input use, site-specific irrigation, and early intervention workflows for farm managers.
“A 380-hectare soybean trial in Mato Grosso, Brazil, mapped early-stage drought stress via satellite-derived NDVI anomalies 9 days prior to the appearance of visible wilting, guiding sub-zone irrigation decisions and reducing yield loss by 7% (Embrapa, 2026).”
What You’ll Learn About NDVI Satellite Crop Monitoring 2026
- How NDVI satellite crop monitoring 2026 detects crop stress before symptoms emerge
- Technical breakdown of remote sensing and vegetation indices in precision agriculture
- Comparison of satellite image sources, accuracy, and cost per hectare
- Adoption evidence from peer-reviewed field trials and commercial deployments
- Critical questions on ROI, data integration, and connectivity for large-scale agricultural land
NDVI Satellite Crop Monitoring 2026: A Technology Threshold in Remote Sensing
In southern Brazil’s 2025–26 soybean season, a technology inflection arrived: NDVI satellite crop monitoring 2026 pinpointed canopy stress nine days before visible symptoms, verified by independent physical scouting and follow-up tissue analysis (Embrapa, 2026). This level of anticipation—undetectable by visual inspection or drone overflight—rested on denser revisits, broader multispectral coverage, and enhanced anomaly detection algorithms.
The transition from 16-day to sub-5-day satellite passes (Sentinel-2, PlanetScope) and 2–10m spatial resolution opened new possibilities in precision ag that legacy remote sensing applications could not address. Anomalous NDVI values—exceeding two standard deviations below parcel mean—triggered irrigation or micronutrient protocols before necrosis or wilting emerged at the ground surface. This threshold marks a shift: from confirmatory sensing to predictive intervention, directly supporting zone-specific crop management at field scale.
How Vegetation Indices and NDVI Satellite Crop Monitoring 2026 Identify Invisible Crop Stress
Spectral Indices Explained: From NDVI to Advanced Vegetation Index Analytics
Vegetation indices such as the Normalized Difference Vegetation Index (NDVI) remain foundational metrics in satellite-based remote sensing for crop monitor workflows. NDVI—calculated using the red and near-infrared (NIR) reflectance bands—responds precisely to plant physiological stress: drought, disease, nutrient deficiency, and soil type impacts subtly shift canopy reflectance days before anatomical symptoms emerge. The 2026 generation of crop monitor applications can now combine NDVI with derived indices (e. g. , EVI, NDRE), fusing spectral signatures for finer stress discrimination.
The operational gain is substantial: spectral indices not only flag fields at risk but also detail stress sub-type when combined with weather, soil moisture, and growth stage data. PlanetScope’s 3m daily revisits, for example, facilitate rolling anomaly tracking—a central use case in commercial precision agriculture (INRAE, 2026). Advanced analytics now link spectral index amplitude and spatial-temporal anomaly persistence to a thresholding system: persistent negative NDVI deltas beyond four days prompt field investigation or crop input adjustment, with empirical yield protection documented in multi-location trial summaries.
Early Detection: Field Performance of NDVI Satellite Crop Monitoring for Crop Stress
Field validation in the 2025–26 cycle confirms NDVI satellite crop monitoring 2026 delivers actionable insight well in advance of physical scouting results. In both sugar beet (Upper Saxony, INRAE, 2026) and soybean (Mato Grosso, Embrapa, 2026) trials, diminished NDVI values consistently preceded visible symptoms by 7–10 days. Crop type, soil moisture, and ambient weather were stratified to establish signal reliability under diverse conditions.
Critically, the precision ag workflow was not disrupted by satellite revisit gaps or transient cloud cover, as cross-sensor fusion (Sentinel-2 with SkySat, or PlanetScope as gap filler) ensured continuity. Machine learning algorithms, trained on historical anomaly cases, filtered false positives (wind lodging or tillage events) from true crop stress signals. The field deployment conclusion: NDVI satellite crop monitoring now supports early warning, with sufficient accuracy to drive sub-zone decisions at operational scale—provided data integration and actionable intervention protocols are in place (UoN, 2025; INRAE, 2026).
Satellite Imagery and Remote Sensing App Workflows in Precision Ag
Satellite Image Sources and Frequency for NDVI Satellite Crop Monitoring 2026
The surge in satellite image providers and increasing revisit frequency has redrawn the operational map for NDVI satellite crop monitoring 2026. Open-access assets (Sentinel-2, Landsat 9) now deliver 10–30m spatial resolution at 5–16 day intervals, while commercial constellations (PlanetScope, SkySat) achieve 1–3m ground sample distance with up to daily coverage. For sub-field management on commercial agricultural land, this difference in spatial and temporal granularity is decisive: spot stress early, intervene narrower, and save input costs.
However, per-hectare cost and licensing terms shape the optimal workflow. Farm operators deploying precision ag strategies often blend free-tier Sentinel-2 (for low-cost wide-area monitoring) with targeted commercial imaging for high-value fields or during peak risk periods (e. g. , heading, pod fill). Cloud-based remote sensing app platforms—such as OneSoil, EOS Crop Monitoring, or Agremo—now ingest multi-source imagery, harmonize pre-processing, and deploy NDVI on demand, typically outputting geospatial alerts and zone maps directly to operator dashboards or farm ERP systems.
Integrating Remote Sensing App Outputs with On-Farm Decision Platforms
Conversion of satellite NDVI layers into on-farm action hinges on frictionless data integration. Current remote sensing app architectures export NDVI-, NDRE-, or EVI-based stress zone polygons in common GIS formats (GeoTIFF, SHP, KML), supporting direct upload to variable-rate machinery, irrigation controllers, and cloud-based crop monitor platforms. Open API protocols increasingly permit live feed integration, automating NDVI/vegetation index ingestion into custom farm workflows.
Interoperability standards—set by the Open Geospatial Consortium and adopted by prominent precision agriculture software—have accelerated NDVI-driven application layers: real-time alerting, historical trend analysis, and machine learning–based anomaly validation are now routine. Key for large-scale operations is seamless crosswalk from satellite data (with spatial/temporal uncertainty) to actionable prescription maps for input (N, K, P, fungicide), water, or agronomist visits, measured in hours rather than days.
Comparing NDVI Satellite Crop Monitoring 2026 Technologies: Accuracy, Cost, and Deployment
Technology selection for NDVI satellite crop monitoring 2026 pivots on operational scale, required resolution, revisit rate, and cost per hectare. The most reliable workflow is not always the cheapest: sensor selection, image frequency, and platform integration raise different trade-offs in spatial resolution, data latency, and actionable accuracy (NDVI RMSE) relevant for high-value precision ag deployments.
| Provider | Operational Scale | Spatial Resolution | Revisit Rate (days) | Accuracy (NDVI RMSE) | Cost/ha/season (USD) |
|---|---|---|---|---|---|
| Sentinel-2 | >50 ha | 10m | 5 | ±0.07 | Free |
| PlanetScope | >10 ha | 3m | 1 | ±0.05 | 12–24* |
| Landsat 9 | >200 ha | 30m | 16 | ±0.09 | Free |
| Vendor Pro | Custom | 2m | 1–3 | Vendor-claimed | Vendor-quoted |
*PlanetScope cost reflects open-market SaaS platform licensing; verify institutional pricing.
Case Applications: NDVI Satellite Crop Monitoring 2026 in Commercial Agricultural Land
- Sugar beet fungal stress detection in Upper Saxony (25,000 ha, projected ROI 6%, INRAE, 2026)
- Sub-zone nitrogen management in Australian barley (5,900 ha, observed input reduction 8%, UoN, 2025)
- Soybean drought prediction and irrigation optimization in Mato Grosso (Embrapa, 2026) — 7% yield uplift vs. conventional control
These commercial-scale deployments illustrate the cross-crop, cross-continent application of NDVI satellite crop monitoring 2026. Uniformly, operators leveraged the advance warning window for targeted intervention or reduced input use. Critically, observed outcome metrics—yield protection, cost savings—came from research-verified field trials or independent post-season audits, not vendor marketing material.
Crop Monitor Insights: From Detection to Targeted Intervention
The operational chain closes only when NDVI insights inform targeted action. In all cited cases, the crop monitor platform flagged emerging stress via persistent NDVI anomaly mapping. Farmer or agronomist teams then overlaid soil type, crop growth stage, and weather data to triage intervention: fungicide, nutrient, water, or just enhanced ground scouting.
Precision ag traction was highest where remote-sensed NDVI data synced directly with machinery prescriptions and input calendars. For example, the Upper Saxony sugar beet network (INRAE, 2026) reported a six percent projected ROI increase by constraining fungicide sprays to NDVI-verified at-risk blocks. The Mato Grosso soybean trial’s seven percent yield gain (Embrapa, 2026) was attributed to sub-zone irrigation, not full-field response, driven entirely by advance NDVI warnings—not physical plant wilting.
Obstacles and Open Research in NDVI Satellite Crop Monitoring 2026
Cloud Cover, Revisit Intervals, and Sensor Artifacts
Despite remarkable progress in NDVI satellite crop monitoring 2026, recurring technical challenges remain. Intermittent cloud cover still interrupts optical sensor observation, particularly during early vegetative growth or monsoon windows; multi-sensor gap-filling—leveraging both open and commercial constellations—mitigates, but does not eliminate, persistent data gaps.
Revisit intervals and sensor artifacts—ranging from soil moisture confounding, changing sun angle, and surface residue after tillage—also inject uncertainty. The current research agenda focuses on refining machine learning pipelines that flag, filter, or correct spurious NDVI excursions not aligned with agronomic logic. Operators must remain vigilant: all NDVI-based recommendations now carry a confidence rating based on temporal continuity and cross-index (EVI, NDRE) agreement.
Precision Ag Ecosystem: Data Integration and Regulatory Compliance
Robust precision agriculture now depends on integrated data ecosystems, not siloed dashboards. Deployments at scale must align NDVI satellite outputs with weather, soil, and machinery operations—no single platform solves the holistic challenge. In parallel, regulatory and compliance standards are tightening (EU Sustainable Farm 2030 roadmap, Australia NRM 2026 revision): proof is required not only for intervention efficacy but data integrity and traceability.
Operators face emergent questions: how to harmonize remote sensing data across platforms, attribute action to specific stress signals, and partition vendor claims from validated outcomes. Emerging standards for agricultural data interoperability, secure cloud subscription management, and remote sensing application certification are at the forefront for technology buyers and audit bodies alike.
Frequently Asked Questions: NDVI Satellite Crop Monitoring 2026
- How does NDVI satellite crop monitoring 2026 differ from traditional remote sensing in precision agriculture?
NDVI satellite crop monitoring 2026 leverages both higher revisit rates (as low as 1 day) and finer spatial resolution (2–10m versus 10–30m legacy) with integrated machine learning anomaly detection. This supports actionable pre-visual stress alerts, differentiating not just the presence but the type of crop stress, with proven field trial lead times of 7–10 days (Embrapa, 2026). - What are the minimum connectivity and data bandwidth requirements for real-time crop monitoring?
Most real-time NDVI cloud platforms require stable 4G/LTE with ~2–5 Mbps for zone-based map streaming, or satellite uplinks for remote agricultural land. Raw satellite raster downloads are bandwidth-intensive, but processed NDVI alerts and zone files are optimized for low-latency, device-agnostic delivery. - How do false positives and false negatives affect decision-making in NDVI-based crop monitor systems?
Decision-making must account for artifacts (e.g., residue, recent tillage) that can register as false NDVI anomalies. Best practice is integrating NDVI with historical context and secondary indices (EVI, NDRE) and validation via on-ground scouting in priority blocks. Commercial platforms now rate NDVI anomaly “confidence” based on multi-day persistence and cross-index support. - What are the typical ROI and break-even timelines for adopting NDVI satellite crop monitoring 2026?
Projected ROI values from peer-reviewed trials typically range between 5–8% yield protection or 6–10% input reduction within a single season on high-value fields (INRAE, 2026; UoN, 2025). Break-even is often met within 1–2 harvests for operations over 1,000 hectares, when switching from whole-field to zone-targeted input approaches. - Which crops and geographical regions benefit most from current NDVI satellite imagery resolution?
High-density crops (row crops, small grains, oilseeds) in regions with moderate field size (>10ha blocks) see the greatest benefit, especially in temperate and subtropical geographies with reliable moderate revisit intervals. Specialty crops (orchards) are increasingly adopting daily 1–3m imagery for micro-zone detection, but cost-per-hectare is a factor. - What platforms support direct integration of NDVI and other vegetation indices in remote sensing app workflows?
Leading platforms—Planet Analytics, OneSoil, EOS Crop Monitoring, Climate FieldView—offer open API pipelines, allowing NDVI, NDRE, and EVI overlays to sync with farm management systems and variable-rate machinery, with GIS-compatible exports for precision application. - How do field trial results compare with vendor claims for NDVI satellite crop monitoring performance?
Independent field trials (Embrapa, 2026; INRAE, 2026) consistently report advance detection windows and intervention ROI within 0–2% of vendor claims for moderate to high-value row crops. For specialty or fragmented fields, trial results show greater variance, underscoring the need for region- and crop-type-specific pilot testing before full deployment. - What are the ongoing costs per hectare—including licensing, imagery, and precision ag cloud subscriptions?
Sentinel-2 and Landsat 9 are free, with commercial imagery (PlanetScope, SkySat) costing $12–24/ha/season and cloud dashboard fees starting at $1–2/ha/season for multi-feature applications. Overall TCO is determined by revisit demand, resolution needs, and existing integration infrastructure.
People Also Ask: Satellite NDVI Crop Stress Monitoring in 2026
Is NDVI satellite crop monitoring 2026 effective for all crop types?
NDVI satellite crop monitoring 2026 exhibits robust accuracy for most row crops, cereals, oilseeds, and mixed annual cropping systems, with particular efficiency in moderate to large contiguous fields. While performance on perennial crops and orchards (e. g. , citrus, almond, apple) is improving with higher-resolution (1–3m) imaging, intra-block variability can challenge index calibration—making pilot tests essential. Trials show that when field size and crop canopy structure align with satellite spatial resolution, detection window and actionable accuracy hold across diverse geographies.
What accuracy can operators expect from NDVI satellite crop monitoring 2026?
Field-validated RMSE for NDVI measurements ranges ±0. 05–0. 09 in standard 2026 workflows (Sentinel-2, PlanetScope, Landsat 9). Spatial accuracy depends on satellite (2m–30m GSD) and frequency (1–16 day revisit); commercial services tend to outperform open-access for high-density, small-field mosaics. Operators should compare claimed accuracy with peer-reviewed field trial benchmarks, prioritizing solutions with sub-0. 07 NDVI RMSE in pre-season vetting.
Key Takeaways for NDVI Satellite Crop Monitoring 2026
- Sub-10-day detection window for multiple stress types proven in multi-geography trials
- Independent validation mandatory for procurement and compliance—vendor claims are not a substitute
- Precision ag adoption linked to robust NDVI/vegetation index integration and data pipeline reliability
- Cost-per-hectare varies by spatial/temporal resolution and integration with existing crop monitor platforms
What’s Next? NDVI Satellite Crop Monitoring 2026 and Decision Timelines
The next procurement and planting cycles will be shaped by robust NDVI satellite crop monitoring 2026 adoption, with trial-validated detection windows and ROI now standard. Operators and agtech buyers must scrutinize platform accuracy, integration workflows, and vendor claims. The timing question: are you prepared—with technology, anomaly response protocol, and regulatory records—for the next stress event before it’s visible?